Analytics
Track your April agent's performance with conversation metrics, satisfaction scores, and trends.
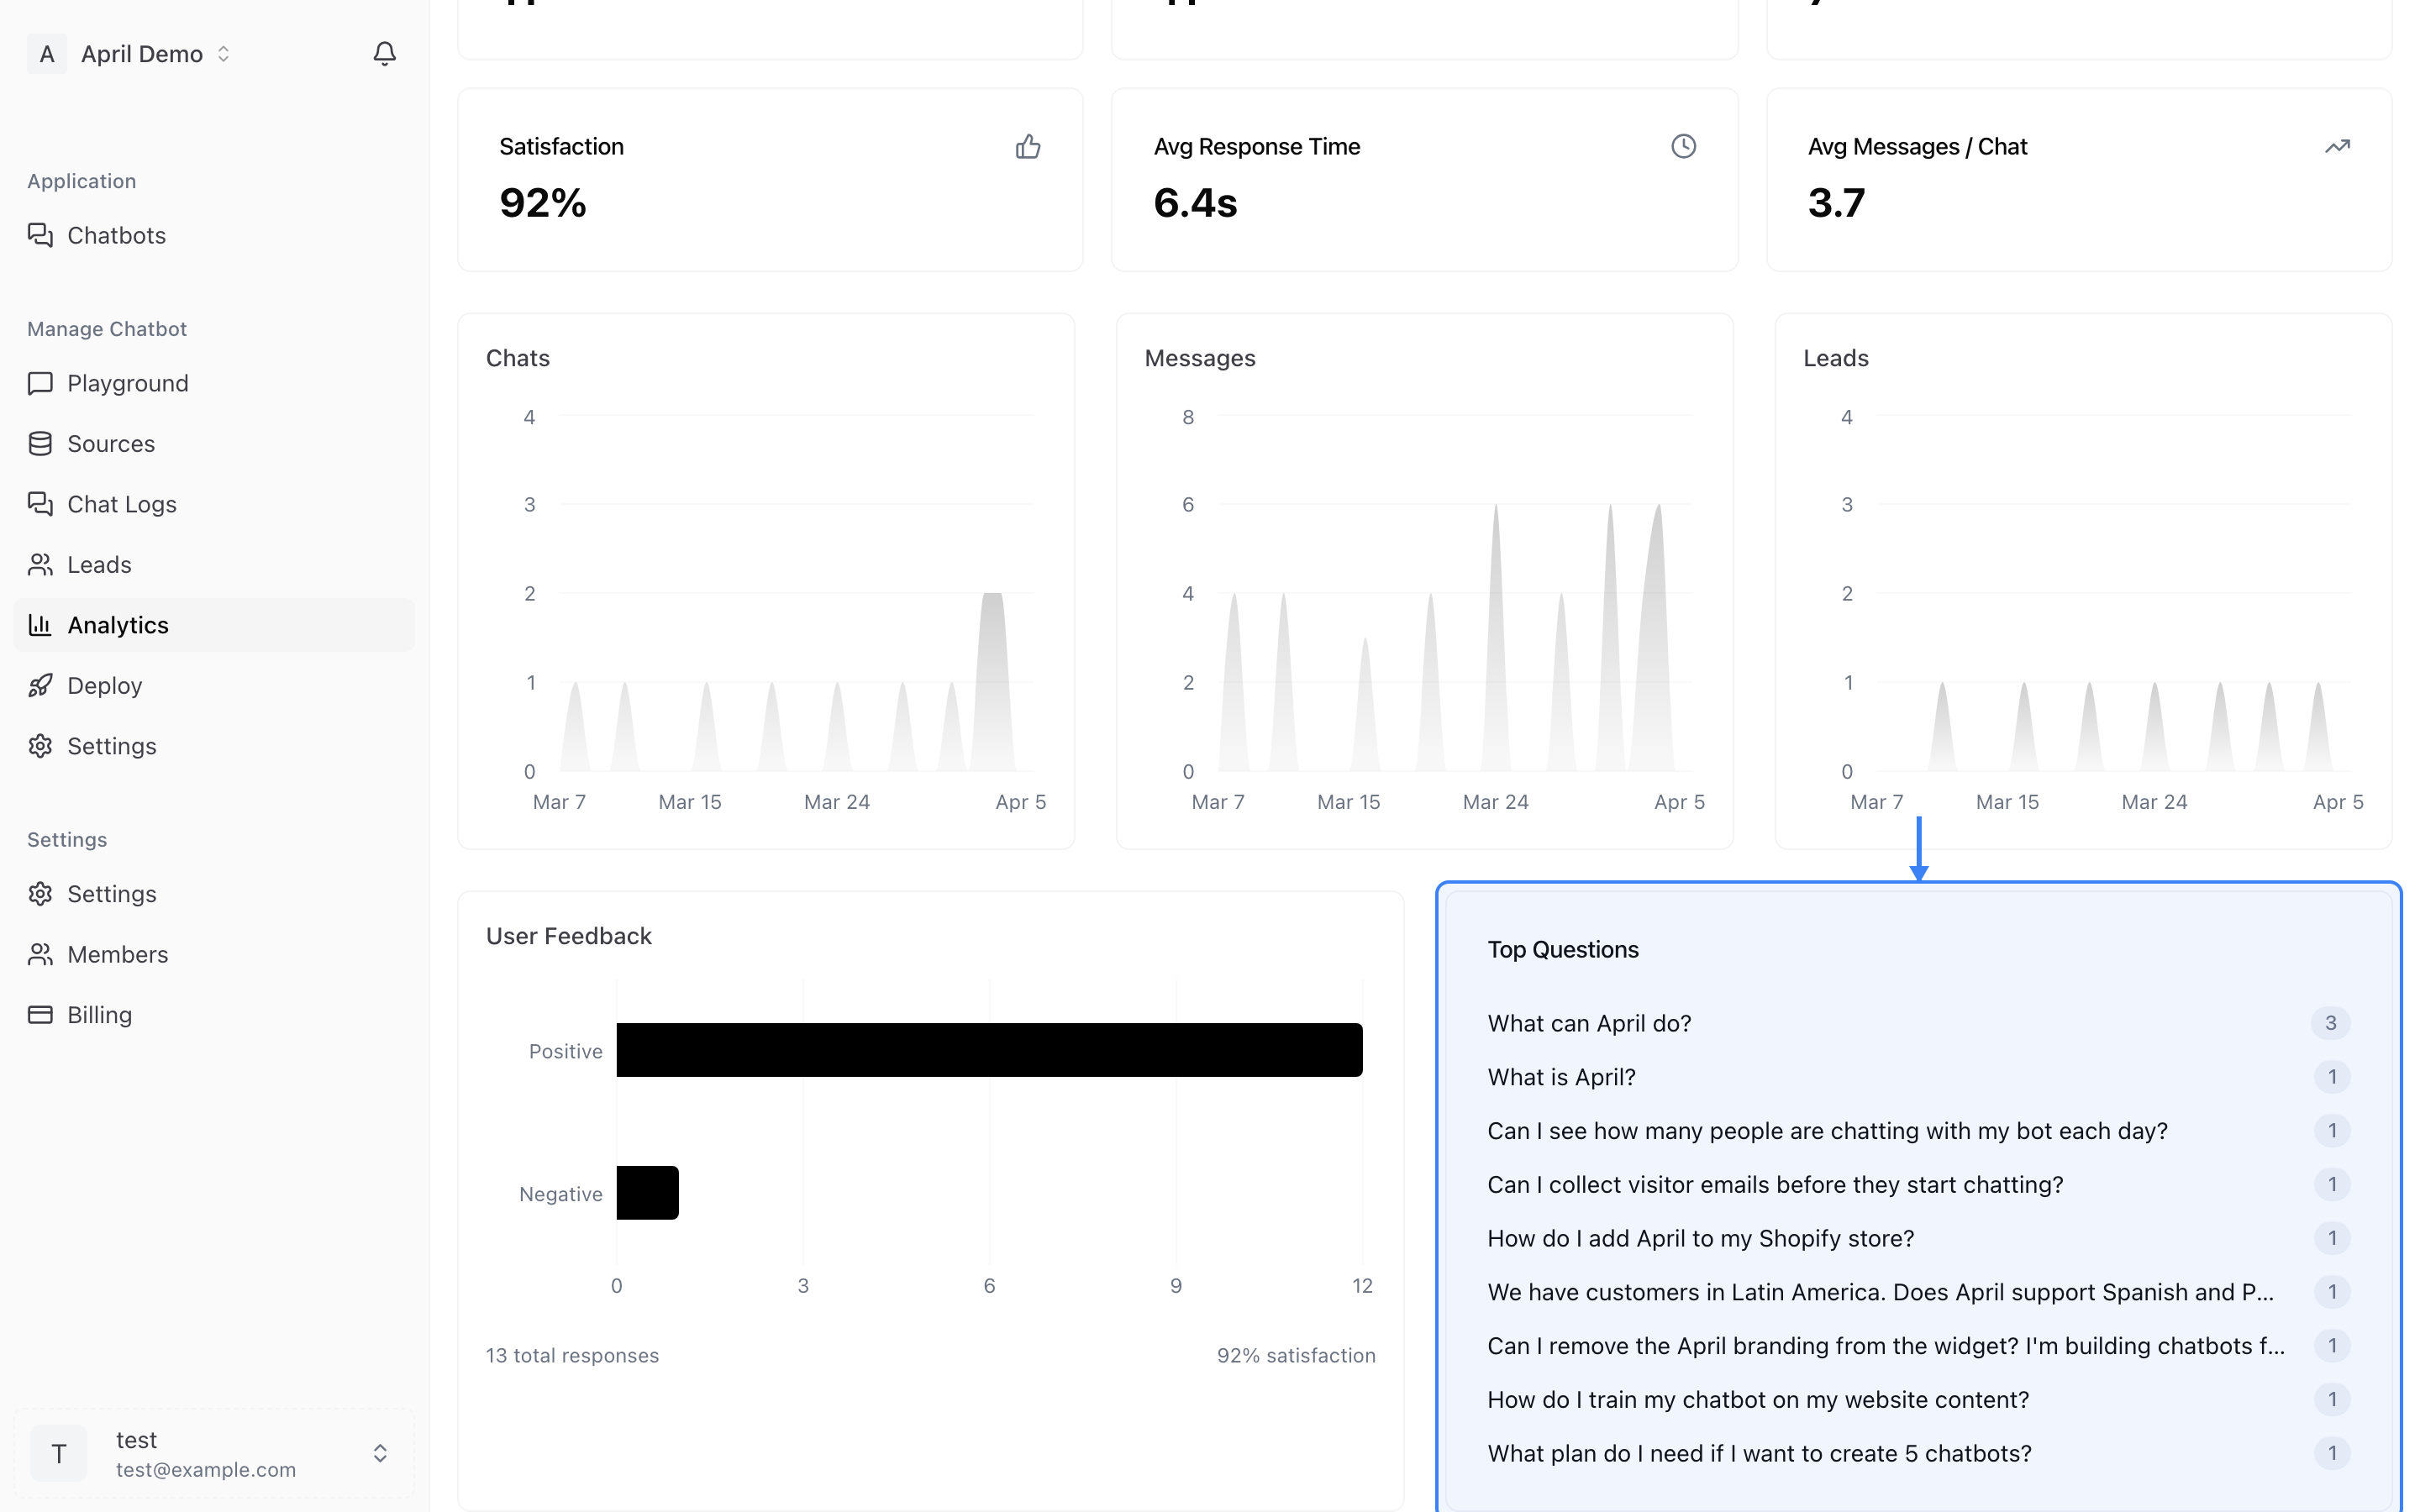
The Analytics dashboard gives you a clear picture of how your agent is performing over the last 30 days.
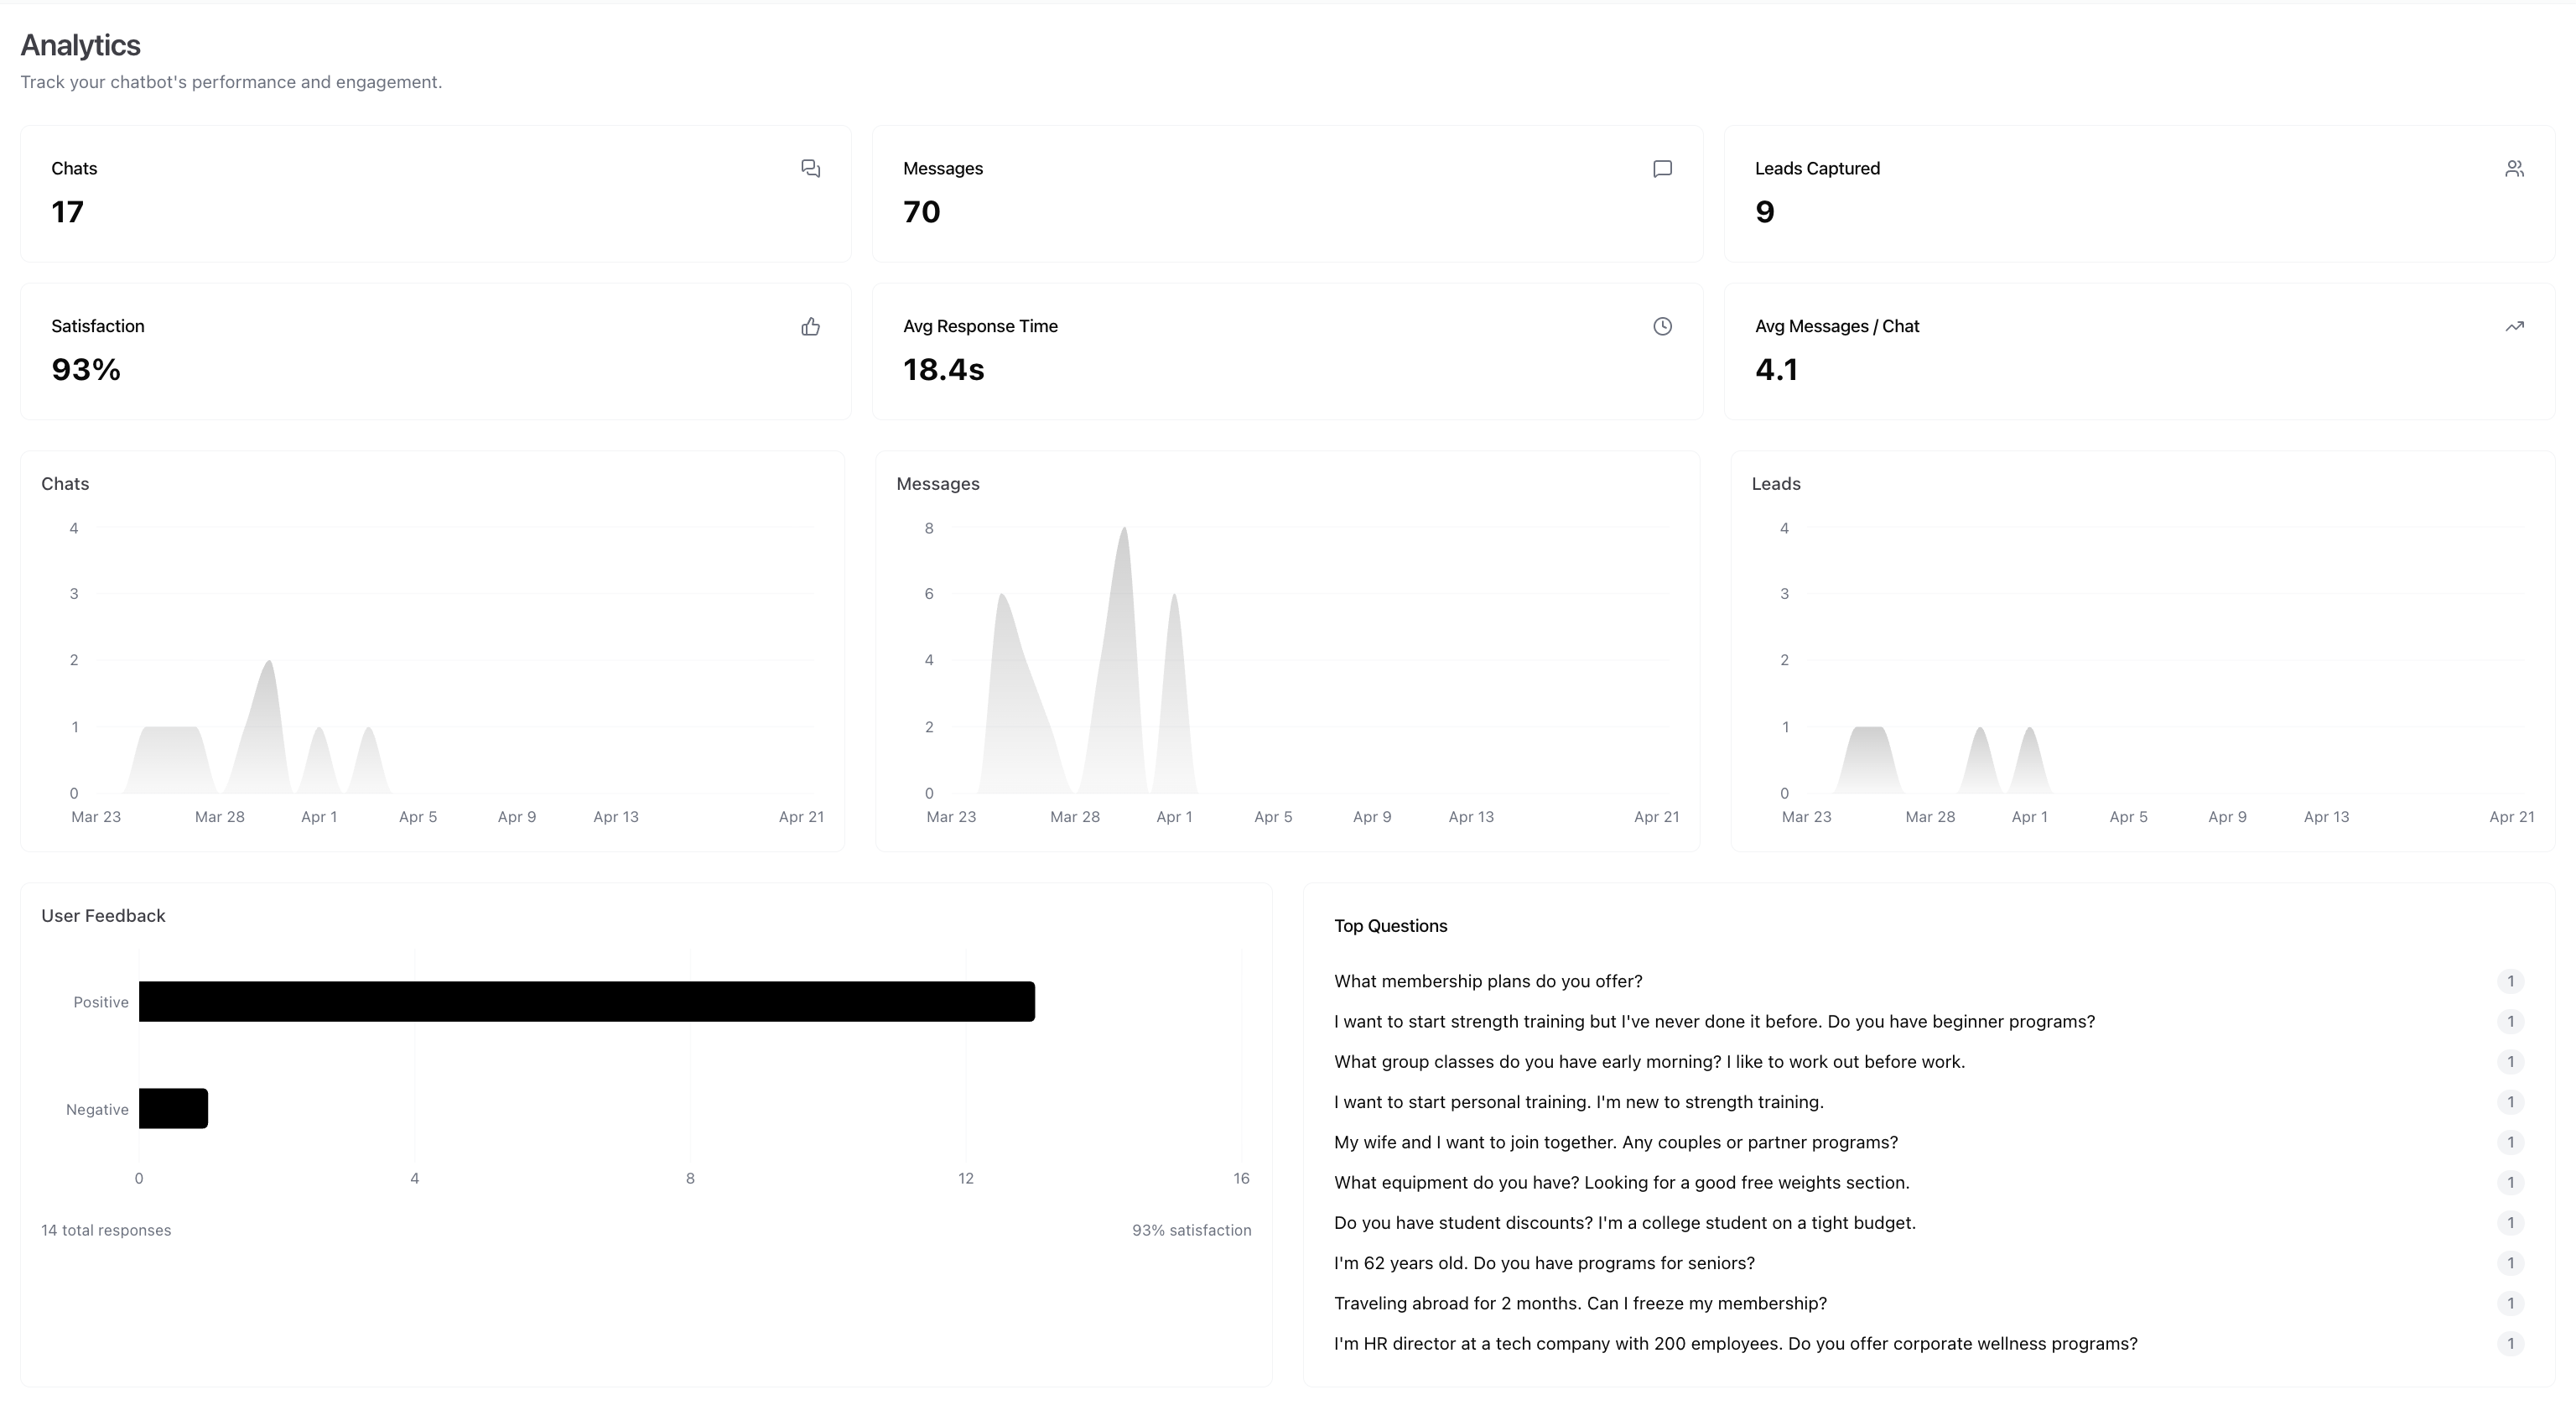
Metrics Overview
Four key metrics are displayed at the top of the dashboard:
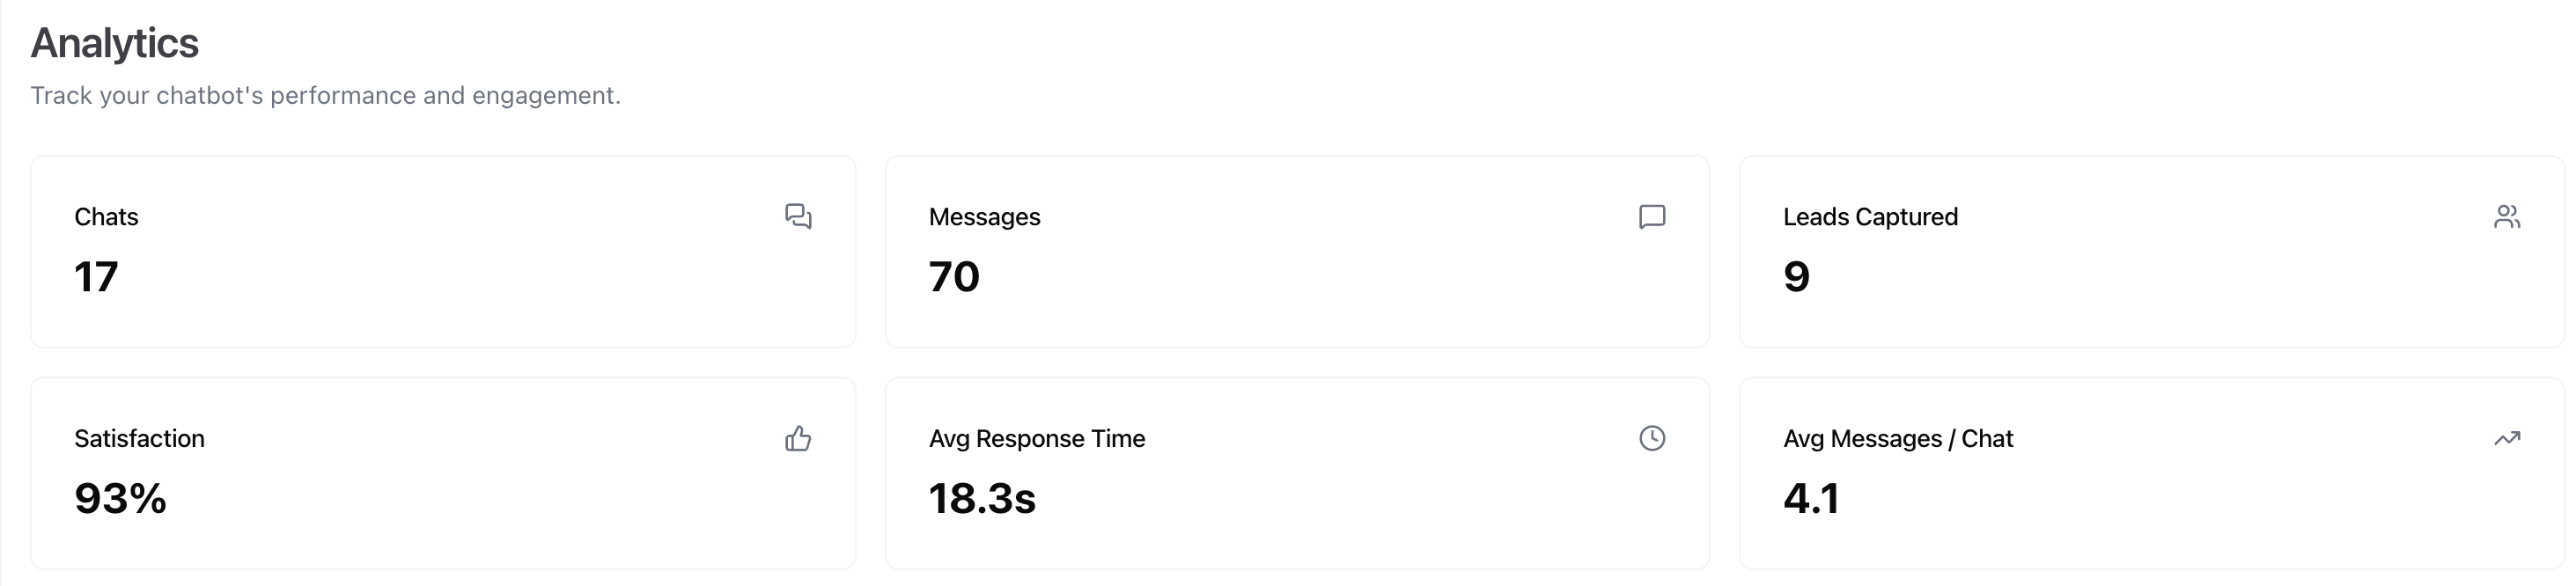
Total Conversations
The number of unique chat sessions started by visitors. A conversation begins when a visitor sends their first message.
Total Messages
The total number of messages exchanged across all conversations, including both visitor messages and agent responses.
Average Satisfaction (CSAT)
Customer satisfaction score based on visitor feedback. Visitors can rate responses with thumbs up or thumbs down. The score is calculated as the percentage of positive ratings.
Conversations Trend
A visual indicator showing whether conversation volume is increasing or decreasing compared to the previous period.
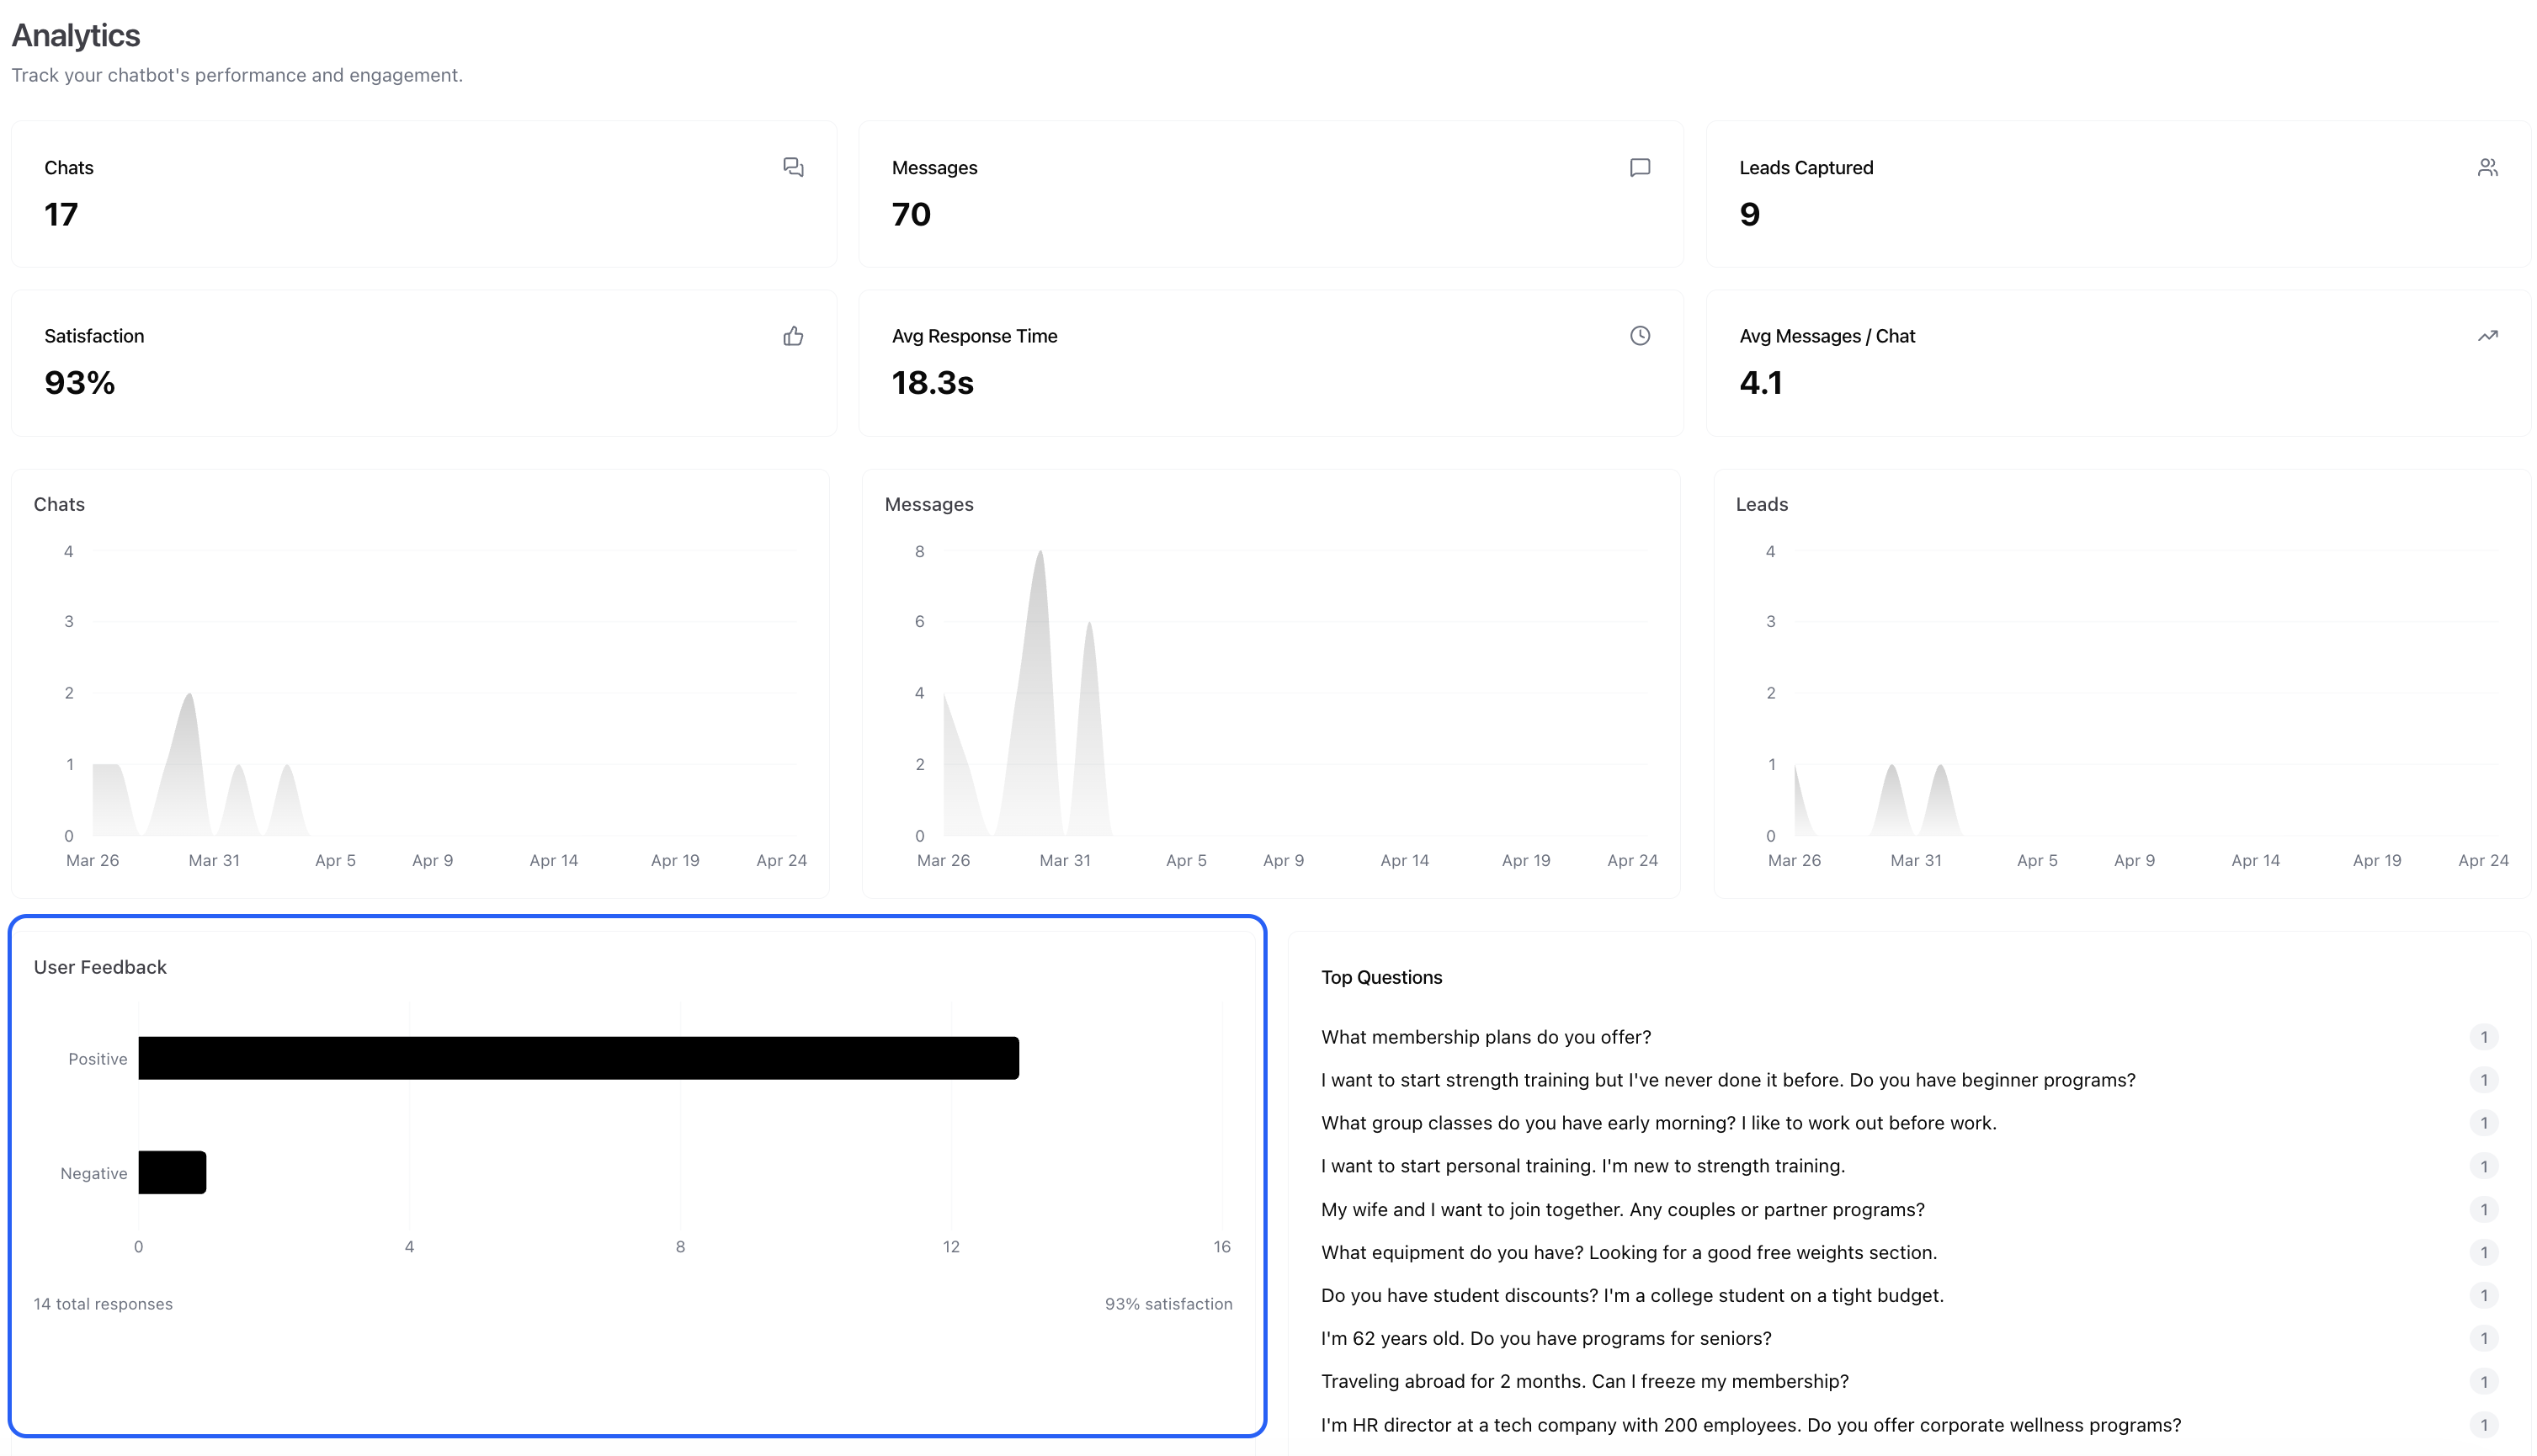
Charts
Conversations Over Time
A line chart showing daily conversation volume over the last 30 days. Use this to identify:
- Peak days and times
- Growth trends
- Impact of marketing campaigns or website changes
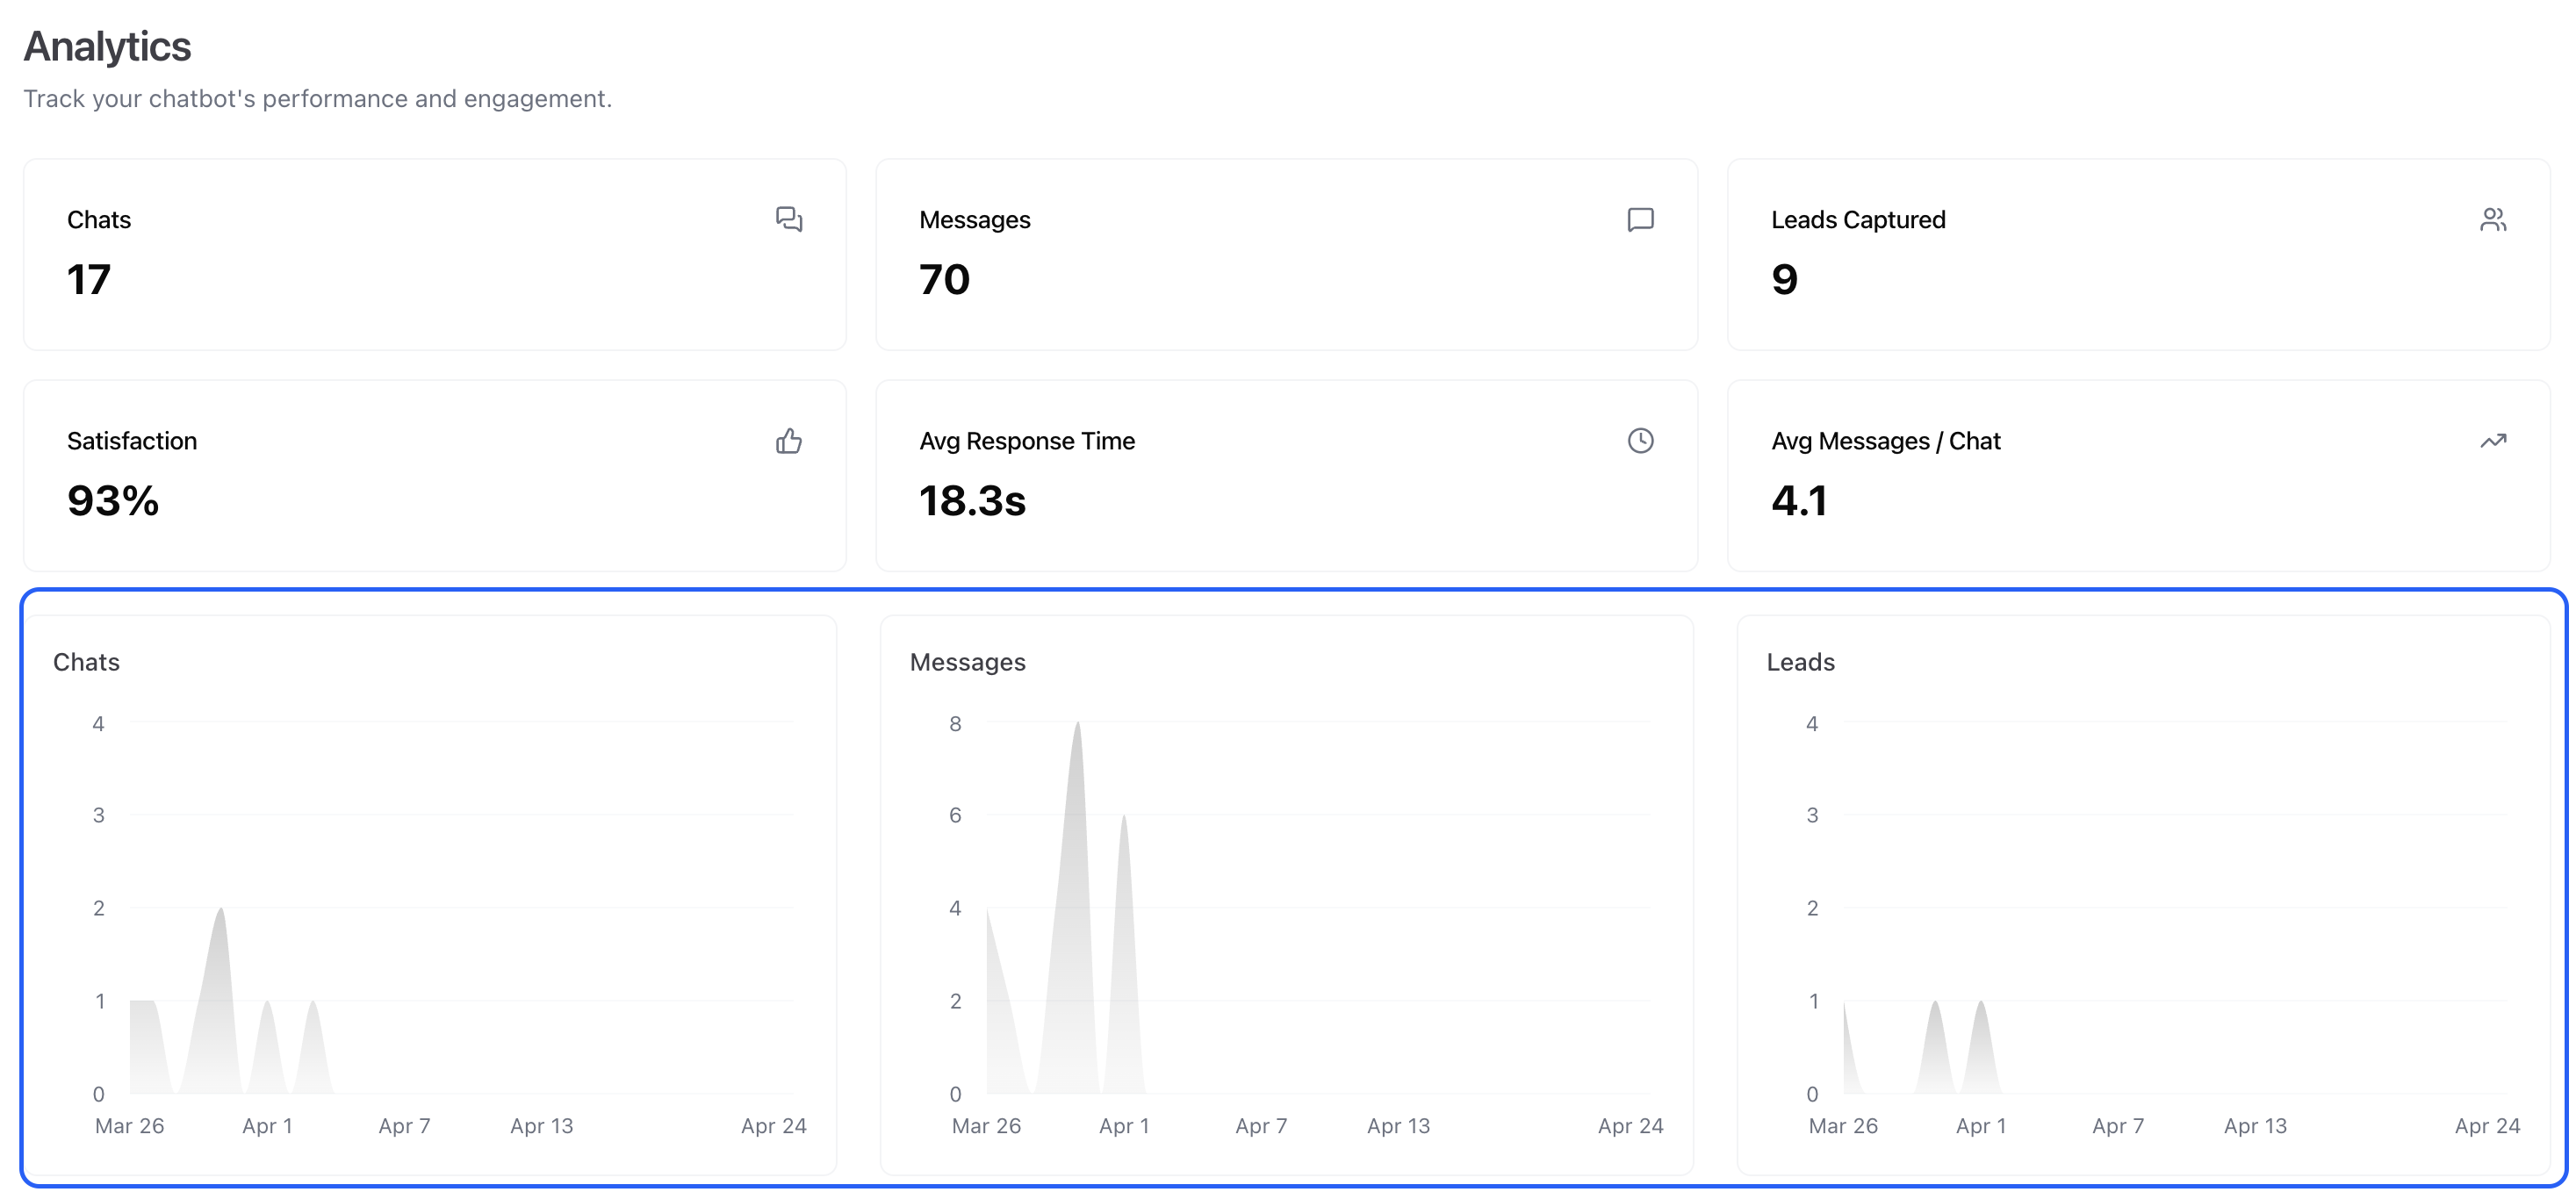
Messages Over Time
A line chart showing daily message volume. Compare with conversations to understand average conversation length.
Top Questions
See what your visitors ask most frequently. Use this to identify content gaps and prioritize which sources to add or improve.
Using Analytics Effectively
- Low satisfaction scores? Check Chat Logs for negative-rated conversations and add missing content to your sources
- High volume, low satisfaction? Your agent may need better training data or refined system instructions
- Growing conversations? Your agent is getting traction — make sure your content stays up to date
- Sudden drops? Check that your widget embed code is still on your website